Kibana and Grafana are two popular open-source DevOps monitoring tools that are very popular in DevOps. Monitoring tools are integral to successful DevOps practices.
Table of Contents
Importance of monitoring tools in DevOps
Monitoring tools play a crucial role in DevOps practices by providing insights, visibility, and control over the entire software development and deployment lifecycle. They help ensure the reliability, performance, and availability of applications and infrastructure.
Key benefits of having good monitoring tools:
- Early Detection of Issues: Monitoring tools allow teams to detect issues, errors, and anomalies in real-time or near-real-time. This early detection enables proactive troubleshooting and prevents minor issues from escalating into major problems.
- Improved Availability and Reliability: Monitoring tools help ensure that systems and applications are available and reliable. They track uptime, downtime, response times, and service levels, enabling quick identification and resolution of outages or performance bottlenecks.
- Rapid Problem Resolution: Monitoring tools provide detailed insights into the root causes of problems. This helps DevOps teams identify the source of issues faster and resolve them efficiently, reducing downtime and minimizing the impact on users.
- Capacity Planning and Scaling: Monitoring tools provide data on resource utilization, such as CPU, memory, disk, and network. This information aids in capacity planning, helping teams allocate resources appropriately and scale infrastructure as needed.
- Performance Optimization: Monitoring tools offer visibility into application performance metrics. DevOps teams can analyze data to identify performance bottlenecks, optimize code, and improve user experience.
- Automated Alerts and Notifications: Monitoring tools can send automated alerts and notifications when predefined thresholds are breached. This allows teams to respond quickly to critical events and reduce mean time to resolution (MTTR).
- Trend Analysis and Reporting: Monitoring tools collect historical data, enabling trend analysis over time. This data helps teams identify long-term patterns, plan for growth, and make informed decisions based on historical performance.
- Security and Compliance: Monitoring tools help detect and prevent security vulnerabilities, unauthorized access, and compliance violations. They can track access logs, monitor network traffic, and identify potential threats.
- Feedback Loop for Continuous Improvement: Monitoring tools provide valuable feedback on the performance of new releases and updates. DevOps teams can analyze this feedback to make iterative improvements and ensure that changes align with user expectations.
- Collaboration and Transparency: Monitoring tools offer a centralized platform where development, operations, and other teams can collaborate, share insights, and make data-driven decisions together.
Kibana
Kibana is an open-source data visualization and exploration tool that is part of the Elastic Stack, which includes Elasticsearch, Logstash, and Beats. Kibana is commonly used for log and event analysis, as well as creating dashboards and reports from structured data.
Key features of Kibana:
- Data Visualization: Kibana allows users to create a wide variety of visualizations, including line charts, bar charts, pie charts, maps, gauges, and more. These visualizations help transform raw data into meaningful insights and allow users to easily spot trends and patterns.
- Dashboard Creation: Users can combine multiple visualizations into interactive dashboards. Dashboards provide a holistic view of data and can be customized to display relevant information for specific use cases, such as IT operations, business metrics, and more.
- Elasticsearch Integration: Kibana is tightly integrated with Elasticsearch, making it a frontend tool for Elasticsearch indexes. Users can query and analyze data directly from Elasticsearch and visualize the results in Kibana.
- Data Exploration: Kibana’s Discover feature allows users to explore and search through their data. It offers a user-friendly interface for building queries, filtering data, and viewing raw documents.
- Machine Learning Integration: Kibana provides integration with Elasticsearch’s machine learning capabilities. Users can create anomaly detection jobs to automatically identify unusual patterns and anomalies in their data.
- Time Series Data: Kibana is particularly well-suited for visualizing time series data, making it ideal for monitoring and analyzing metrics over time. Users can create real-time monitoring dashboards for applications and infrastructure.
- Alerting and Reporting: Kibana allows users to set up alerts based on specific conditions and thresholds. When conditions are met, Kibana can send out notifications via various channels. Reporting features enable the generation of scheduled reports.
- Maps and Geospatial Analysis: Kibana offers mapping capabilities that allow users to visualize geospatial data on maps. This is valuable for analyzing location-based data and creating location-aware visualizations.
- Customization and Extensions: Kibana provides the ability to customize and extend its functionality using plugins and custom visualizations. This allows users to tailor Kibana to their specific needs.
- Open Source and Community-Driven: Kibana is open source, and its development is supported by a vibrant community. This ensures continuous improvement, updates, and a wealth of resources for users.
- Commercial Support: While Kibana itself is open source, Elastic, the company behind the Elastic Stack, offers commercial support and additional features through its subscription offerings.
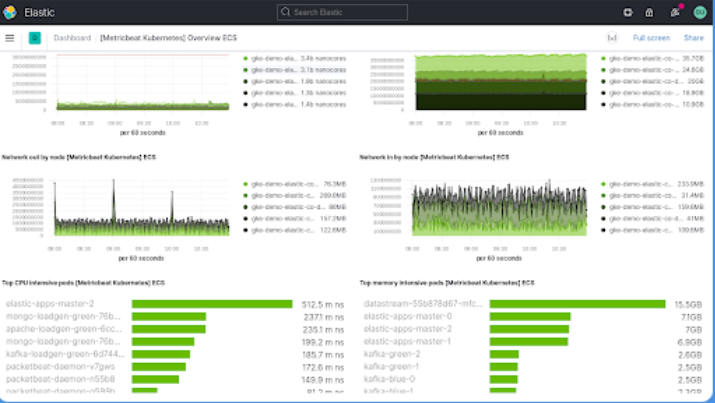
Sample Kibana Dashboard

Grafana
Grafana is a multi-purpose open-source platform used for creating interactive and customizable dashboards for visualizing time-series data. It’s often used for monitoring and analyzing metrics from various sources.
Key features of Grafana:
- Data Source Agnostic: One of Grafana’s standout features is its ability to connect to a wide range of data sources, including databases, cloud platforms, monitoring systems, and APIs. It supports popular databases like Prometheus, Graphite, InfluxDB, Elasticsearch, and more.
- Time-Series Data Visualization: Grafana specializes in visualizing time-series data, making it a perfect fit for monitoring metrics that change over time, such as system performance metrics, application response times, and network traffic.
- Rich Visualization Options: Grafana offers an extensive set of visualization options, including graphs, gauges, heatmaps, tables, and more. Users can create visualizations that suit their specific needs and data types.
- Dashboard Creation: Users can create dashboards by combining multiple visualizations onto a single canvas. Dashboards can be customized with annotations, templates, and variables to provide a comprehensive view of data.
- Alerting and Notifications: Grafana enables users to set up alerts based on thresholds and conditions. When alerts are triggered, users can receive notifications via various channels such as email, Slack, or other alerting integrations.
- Templating and Variables: Grafana supports variables and templating, allowing users to create dynamic dashboards that adapt to different use cases or environments. This is particularly useful for multi-environment monitoring setups.
- Community and Plugins: Grafana boasts a large and active community that contributes to its ecosystem. There is a rich collection of plugins and integrations available, allowing users to extend its functionality and connect to additional data sources.
- User-Friendly Interface: Grafana’s user interface is designed to be intuitive and user-friendly, making it accessible to users with varying levels of technical expertise.
- Flexible Query Editor: The query editor in Grafana supports different query languages, enabling users to write custom queries that fetch the specific data they need for visualization.
- Historical Data Analysis: Grafana allows users to analyze historical data by zooming in on specific time ranges. This is useful for investigating past incidents, identifying trends, and making data-driven decisions.
- Community Dashboards: Grafana’s community shares dashboards and templates that cover a wide range of use cases. Users can leverage these community-contributed dashboards to quickly get started with monitoring various systems.
- Commercial Offerings: Grafana Labs, the company behind Grafana, offers commercial offerings that include additional features, support, and managed services for enterprises.
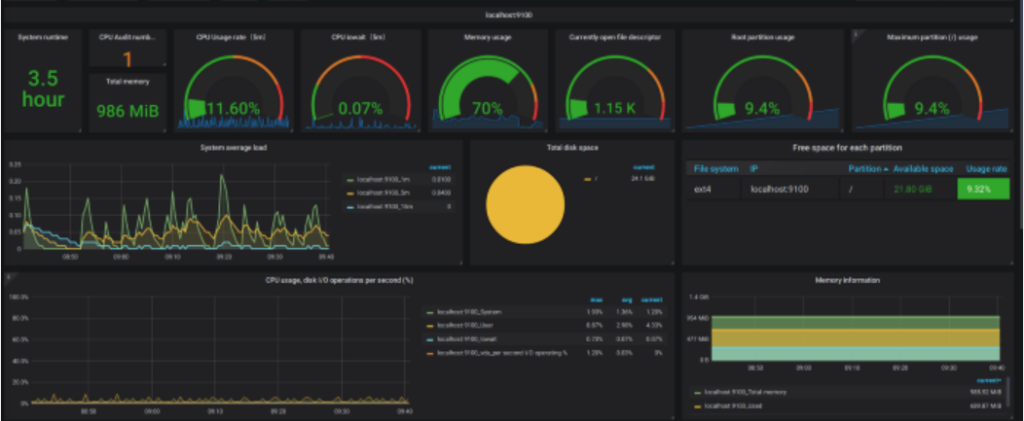
Sample Grafana Dashboard

Summary
Kibana is tightly integrated with Elasticsearch and is used primarily for log analysis, event visualization, and exploration of structured data.
- Grafana is data agnostic and excels in visualizing time-series data from various sources. It’s often used for creating dashboards to monitor system metrics and application performance.
The choice between Kibana and Grafana depends on your specific use case and the type of data you need to visualize and analyze.
You can learn more about cloud and security in our other blogs.
